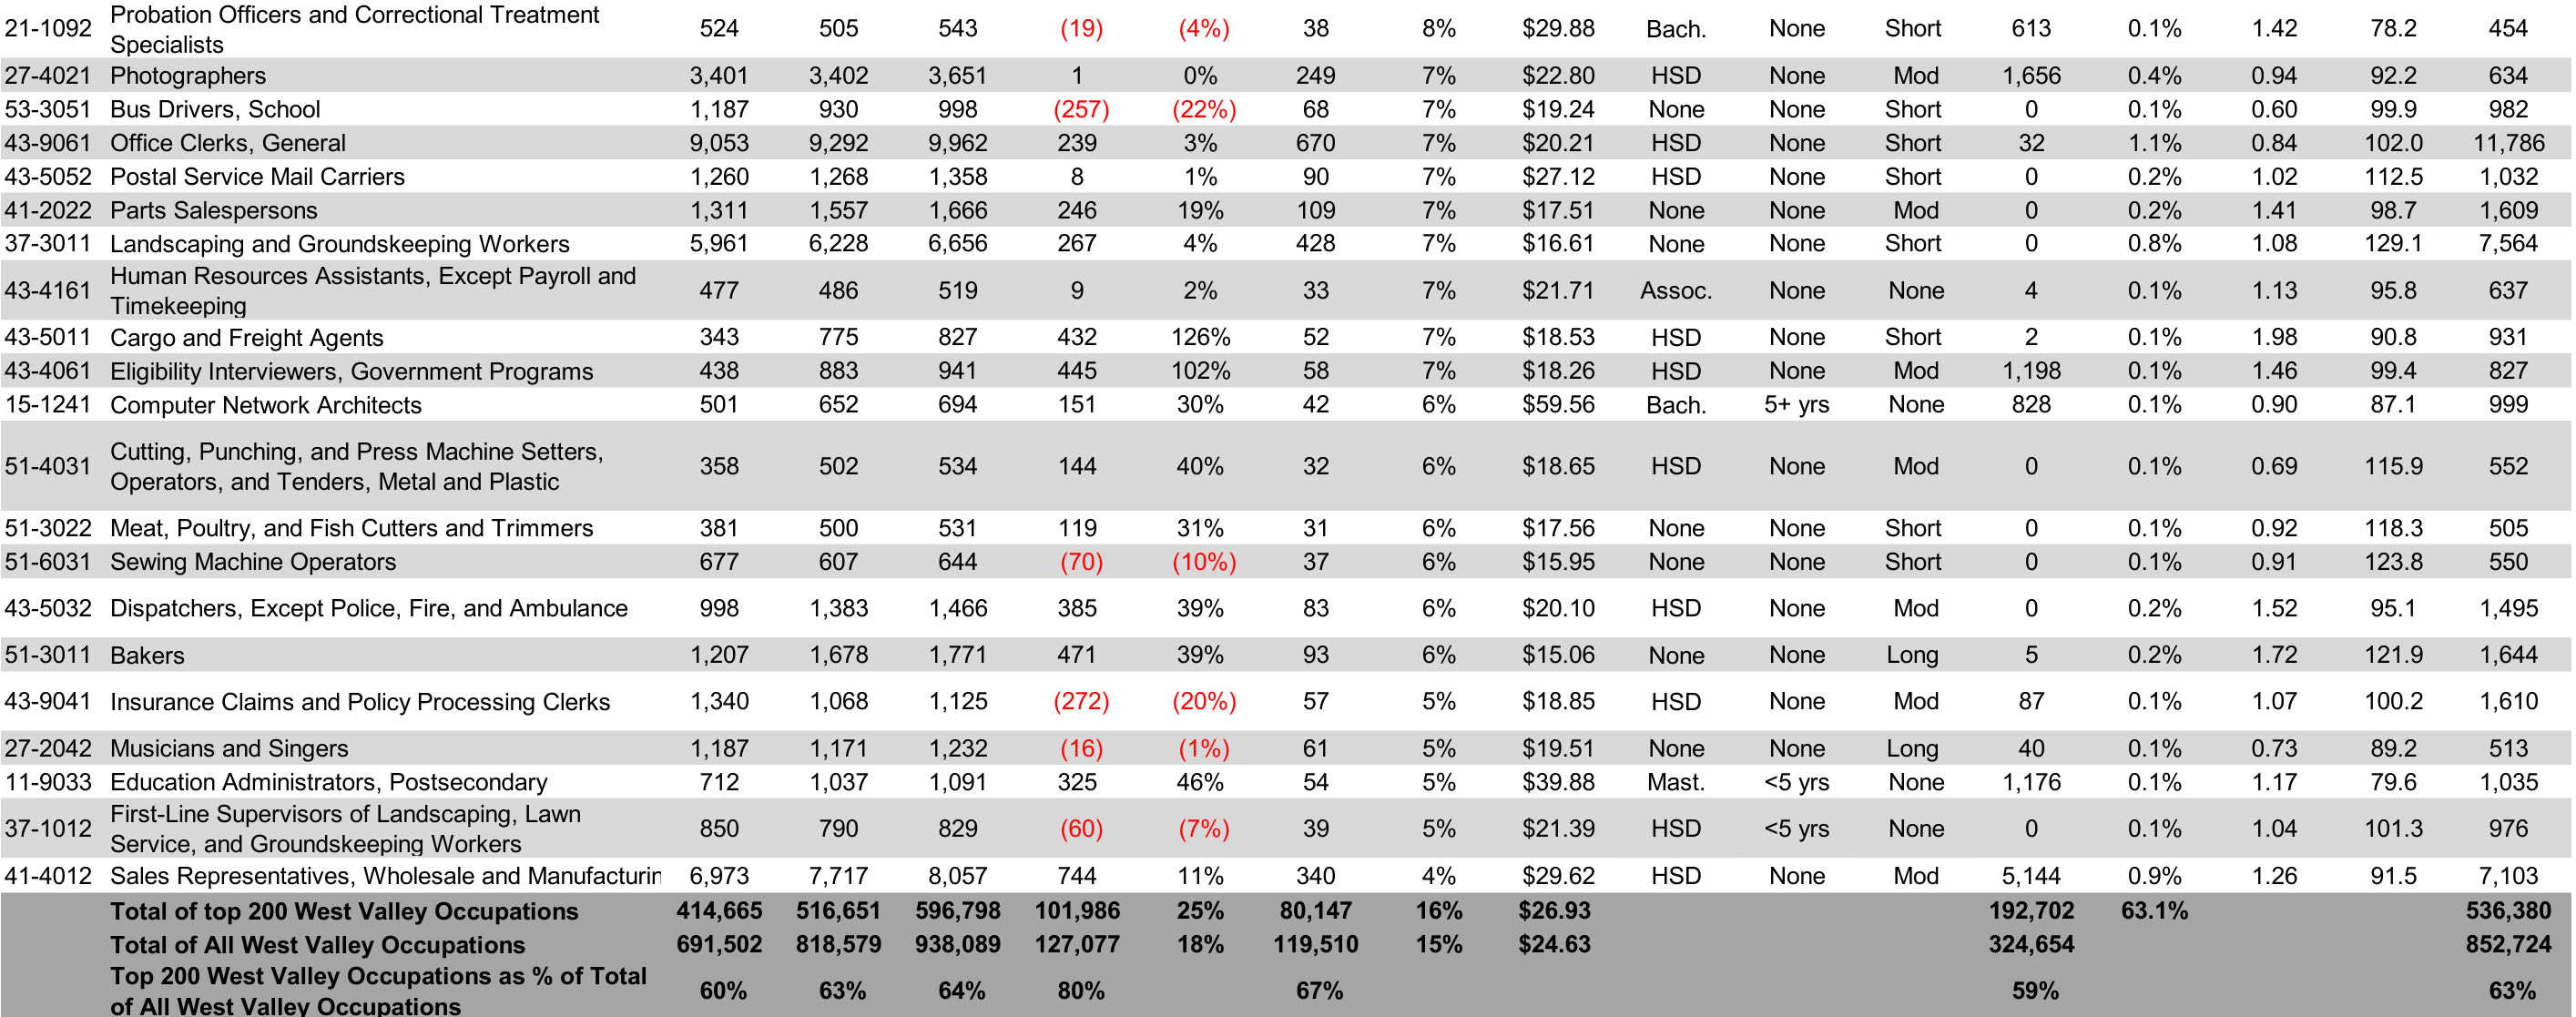
Top 200 Occupations in the West Valley
Based on:
Projected 5%+ growth from 2022 to 2030
Minimum $15/hr in 2022
2030 Employment Projection > 425
Location Quotient >= 0.5
West Valley Resident Workers >= 400
See ZIP Codes Definitions for what ZIP Codes define the West Valley
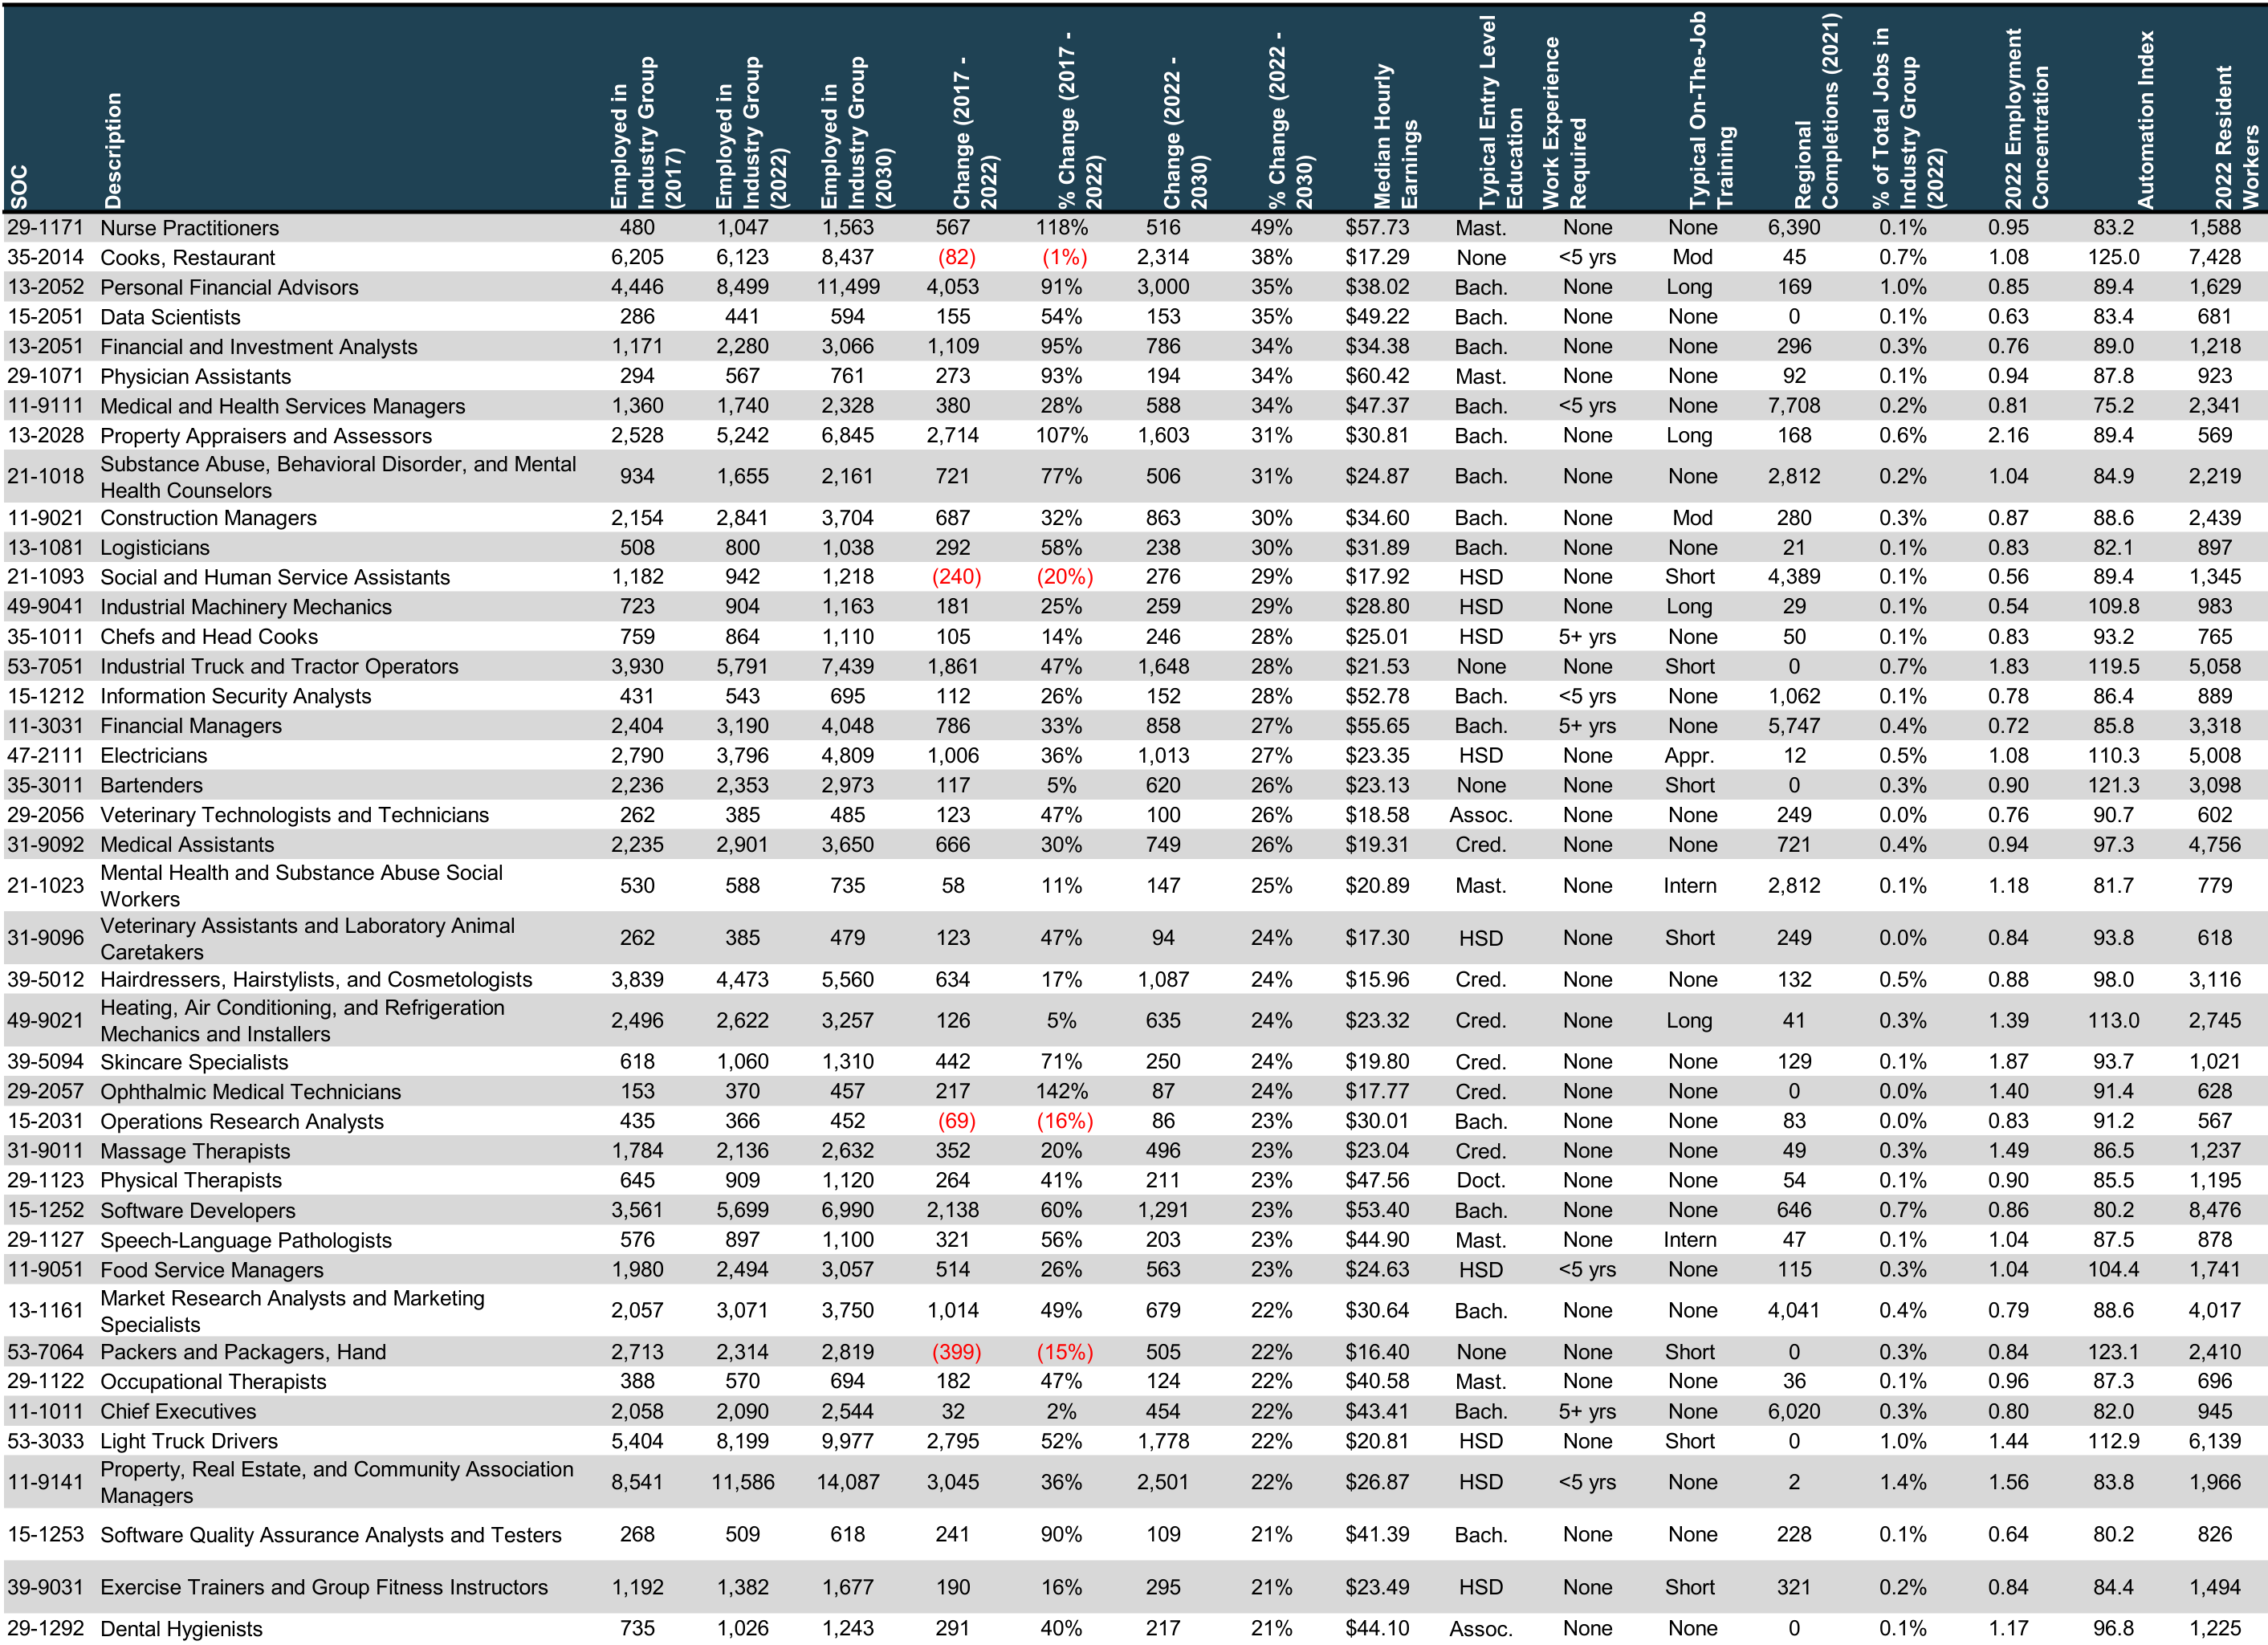
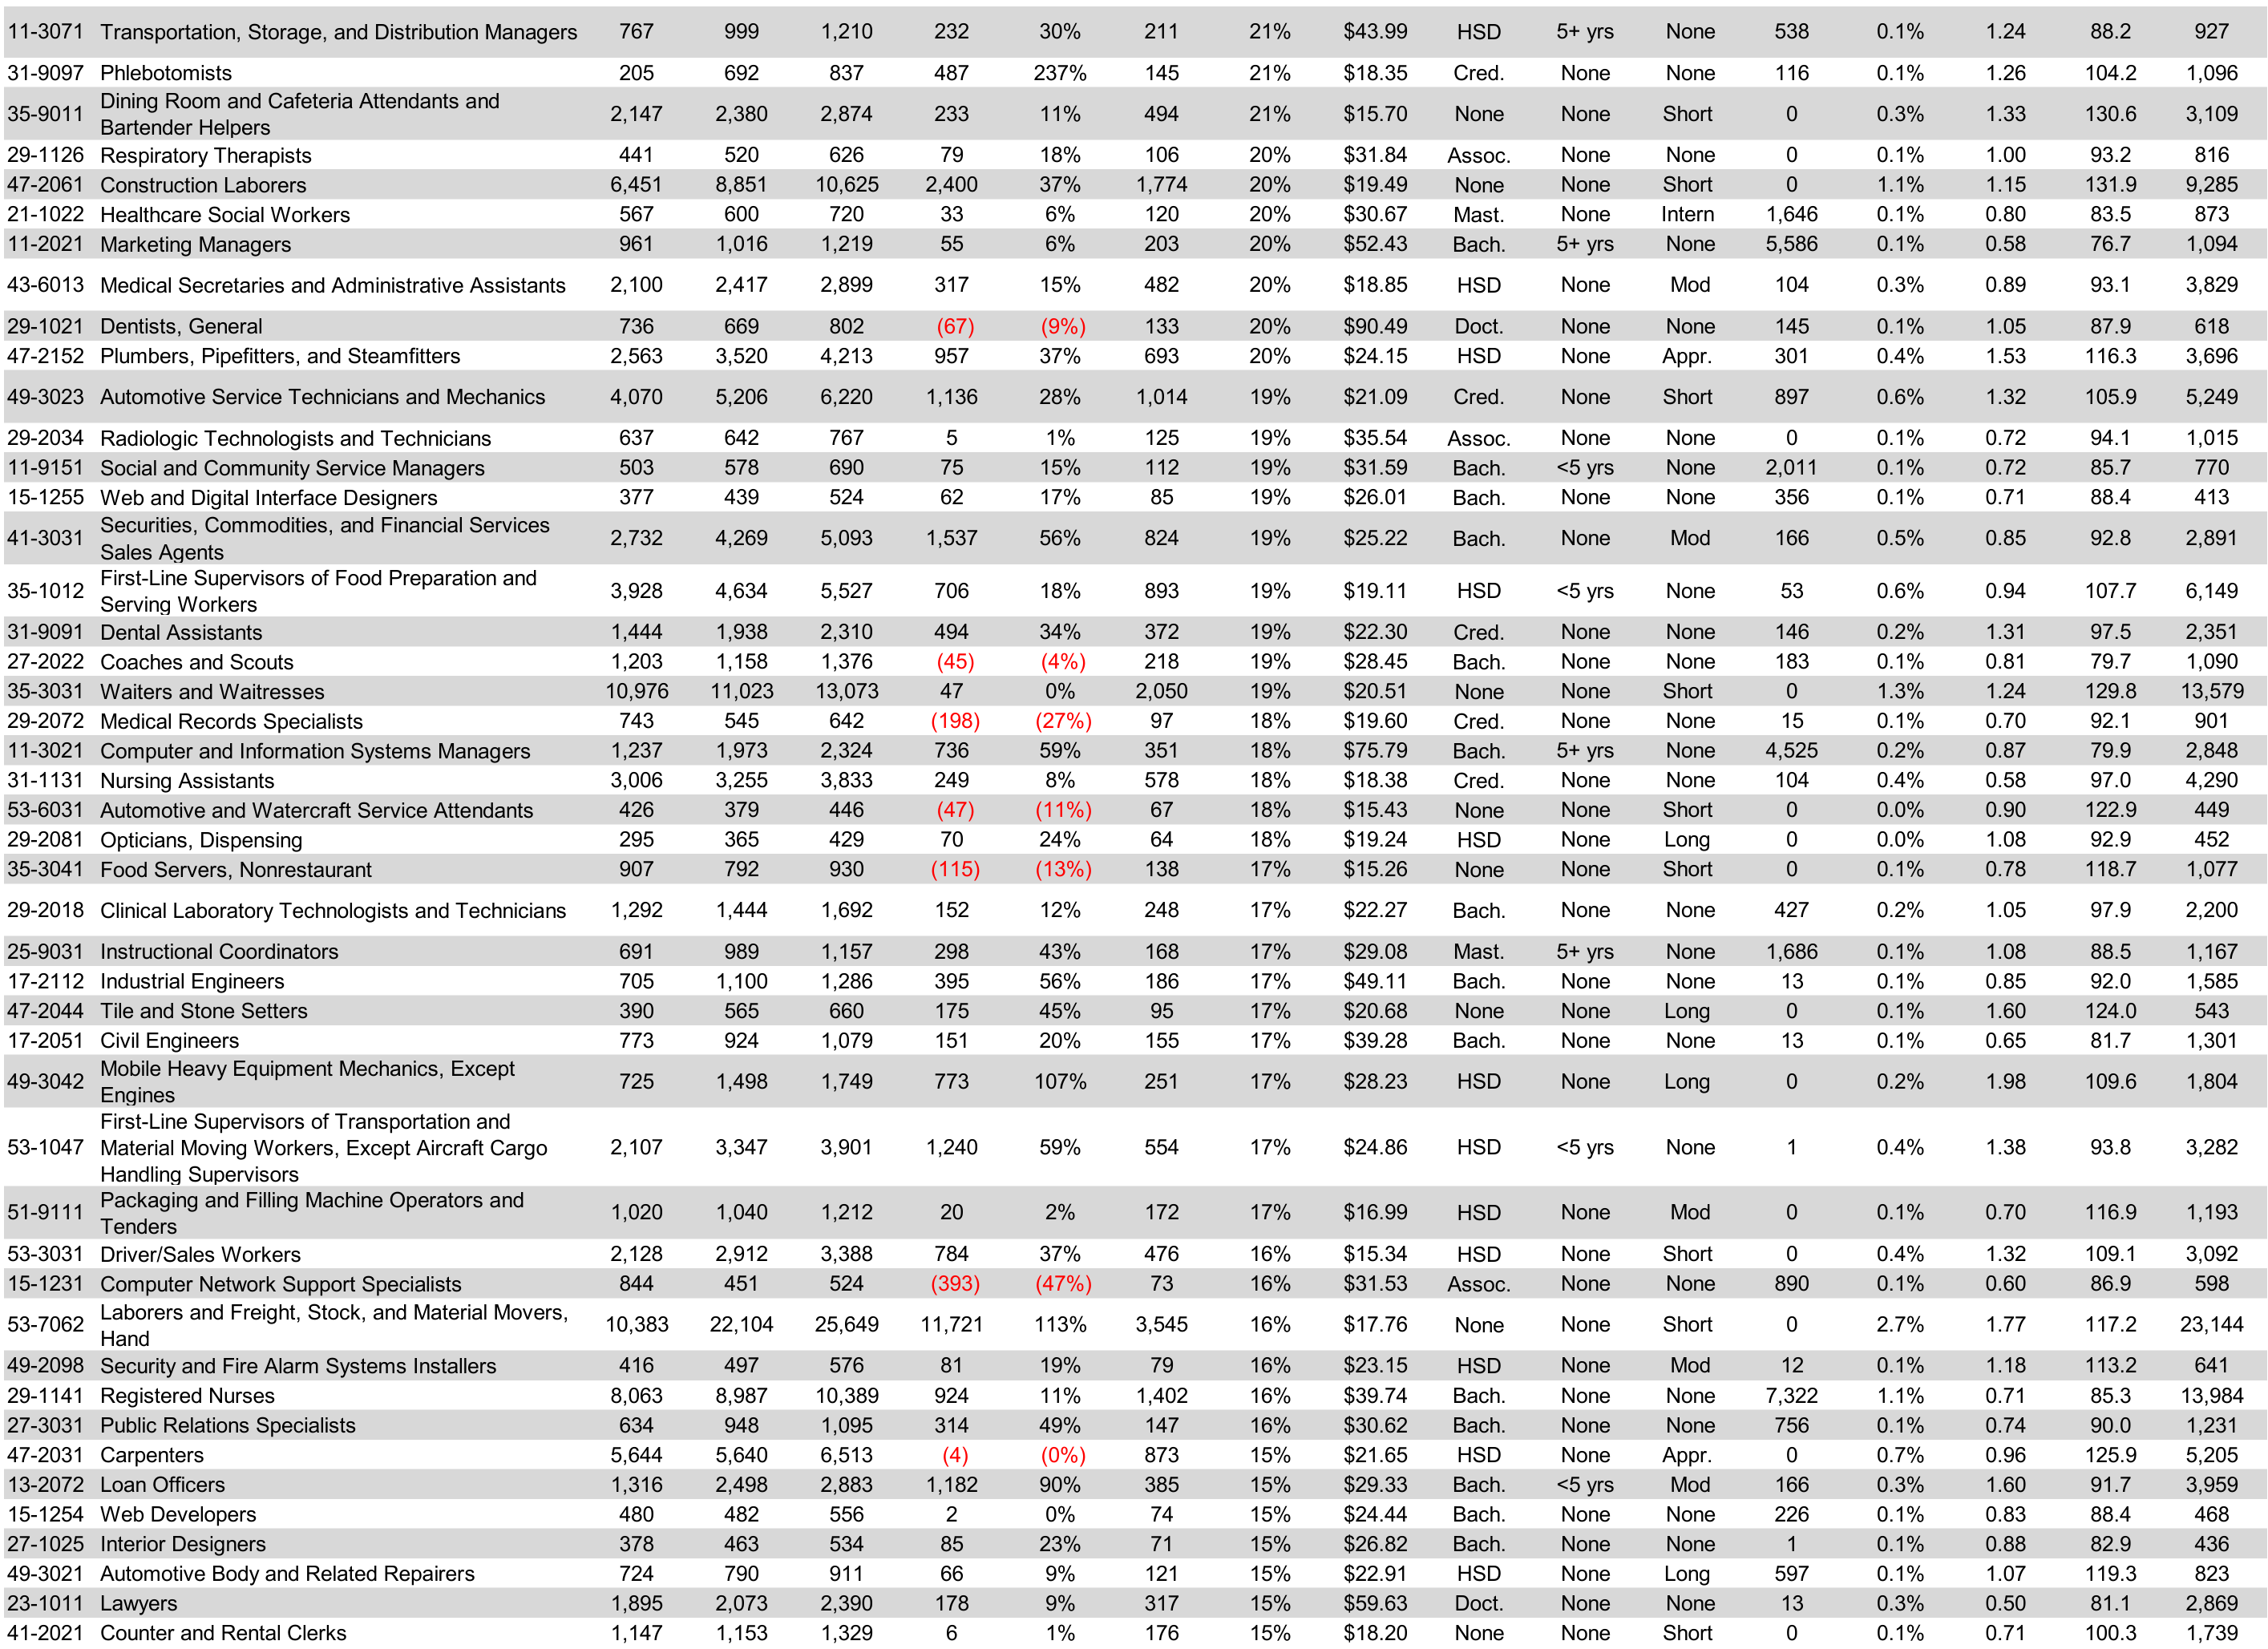
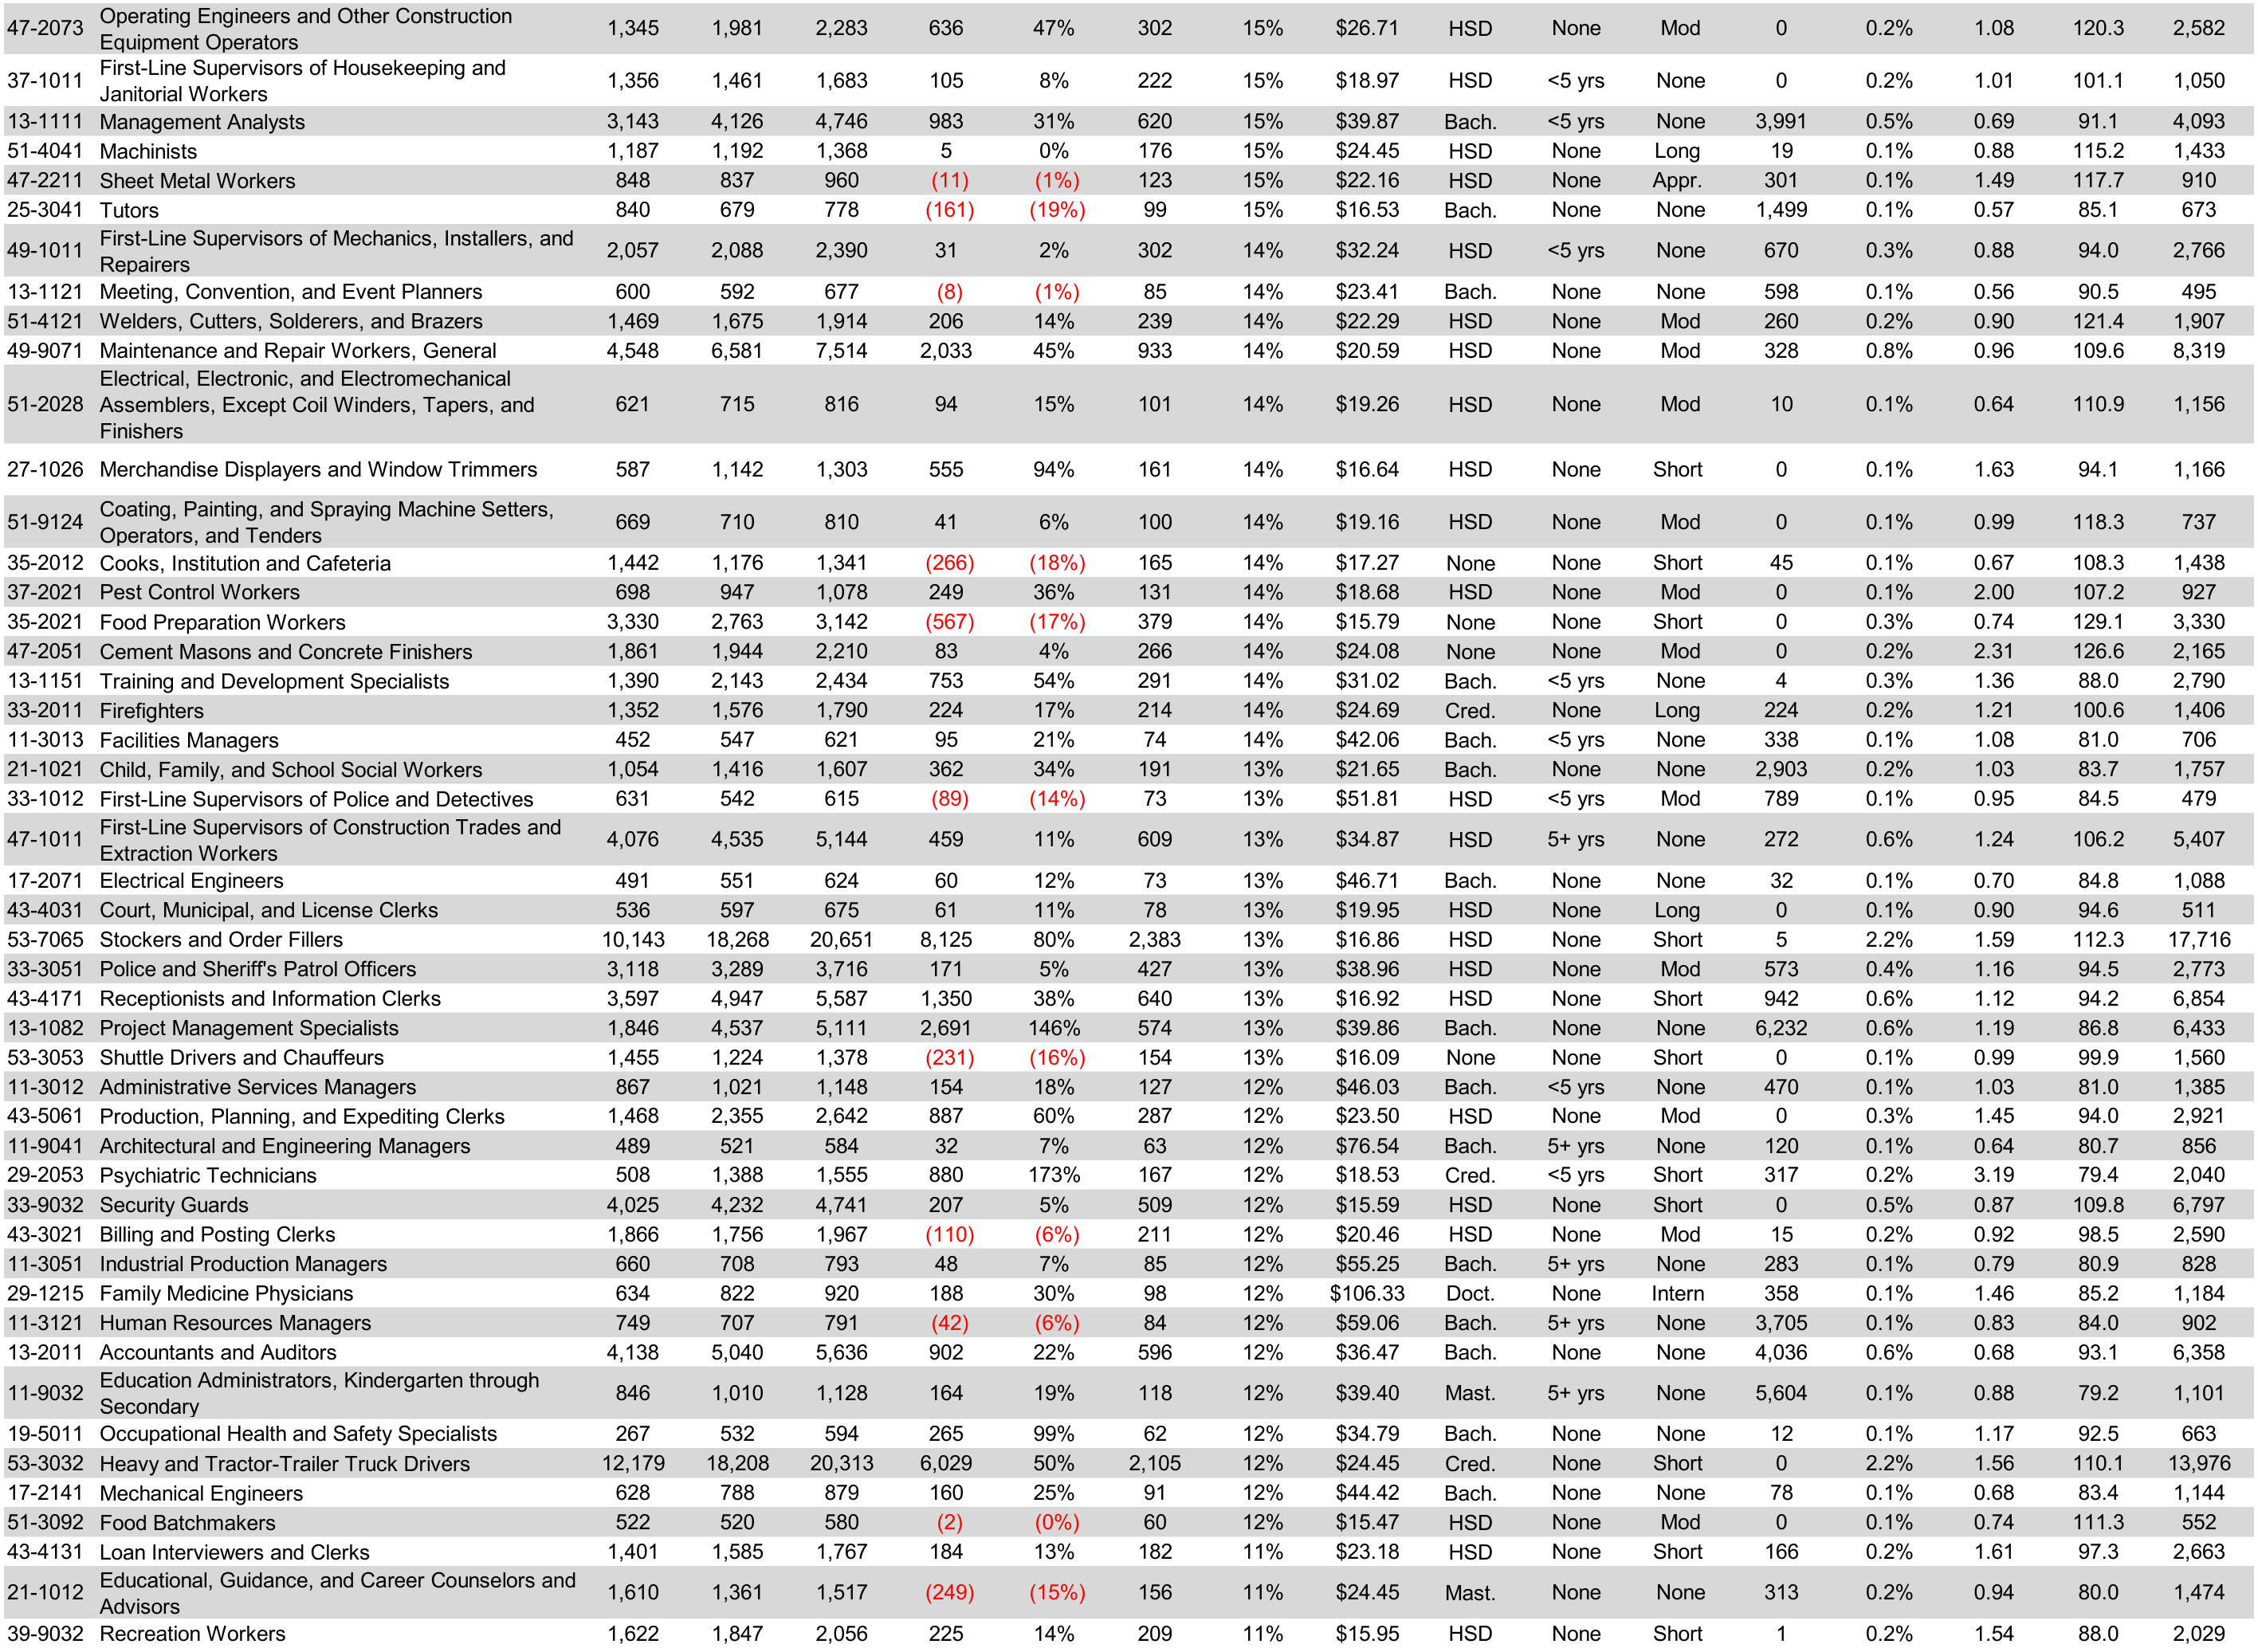
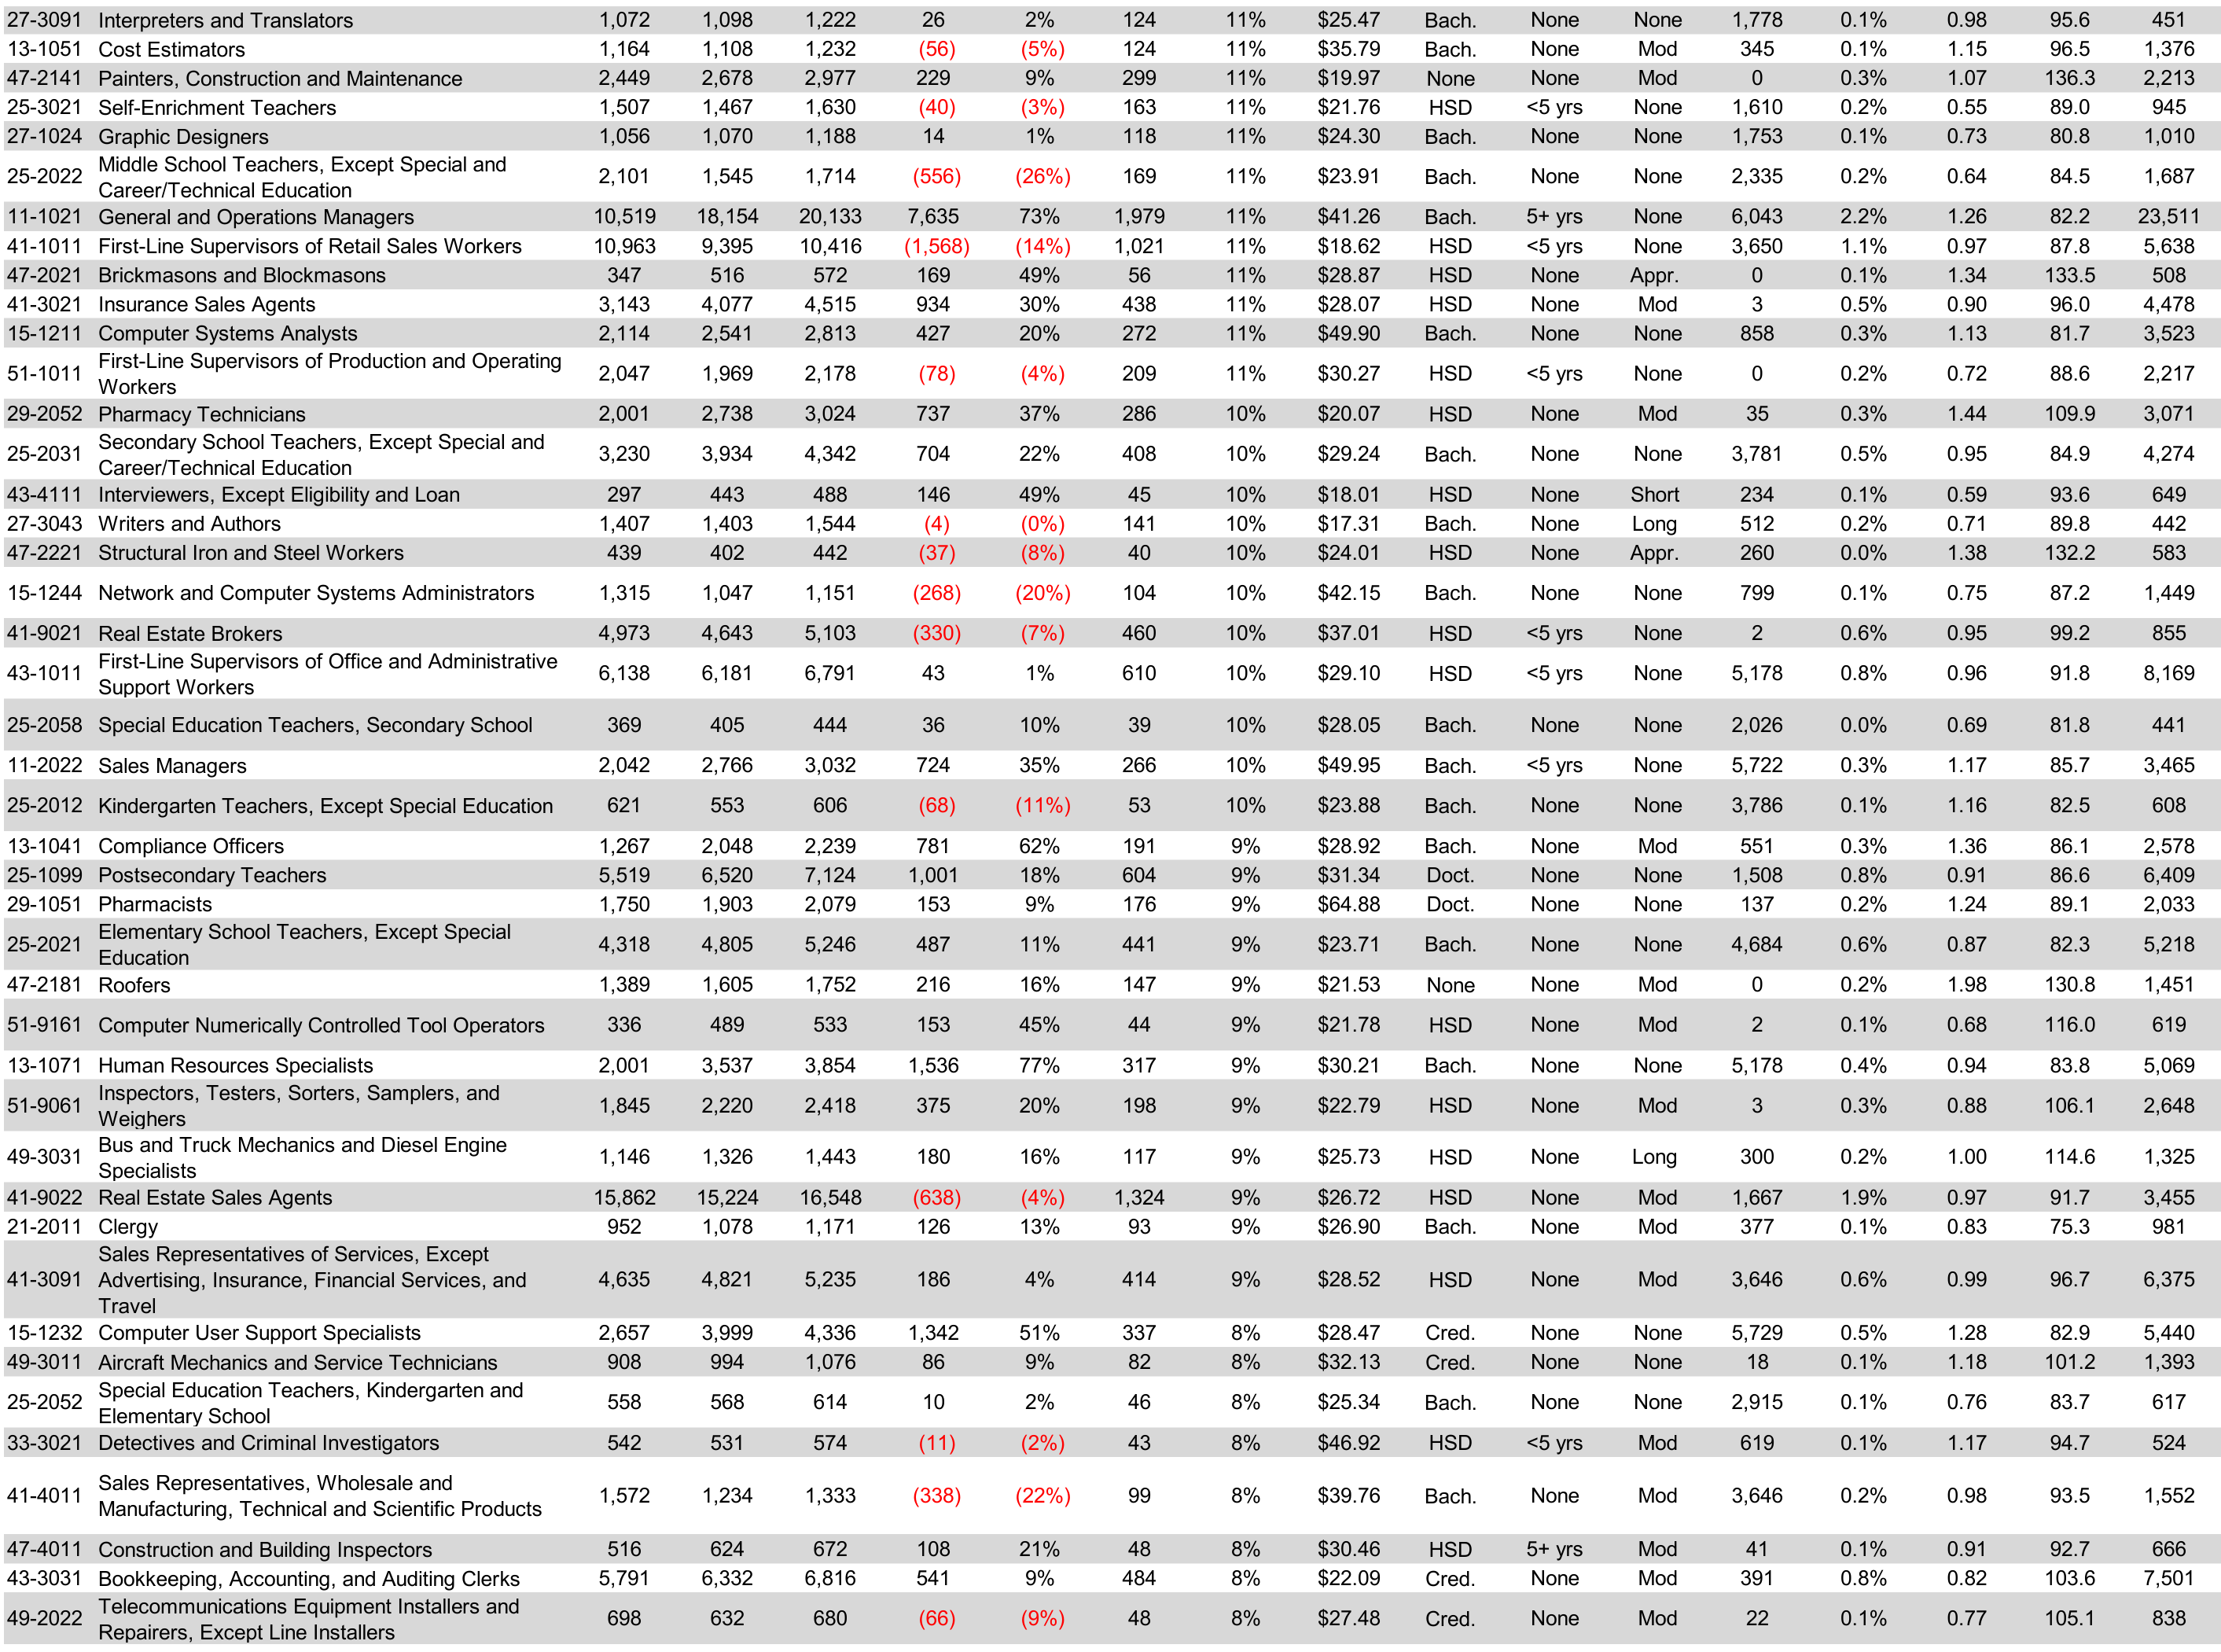
Lightcast Q3 2023 Data Set, pulled October 2023
Typical Entry-Level Education codes:
None = No formal educational credential
HSD = High School Diploma
Cred. = Some college, no degree OR Post-secondary credential
Assc. = Associate's Degree
Bach. = Bachelor's Degree
Mast. = Master's Degree
Doct. = Doctoral or professional Degree
Typical On-the-Job Training codes:
None
Intern = Internship / Residency
Appren. = Apprenticeship
Short = Short-term OJT
Mod = Moderate-term OJT
Long = Long-term OJT
Regional Completions
The number of degrees or certificates conferred for a specific course of study in a given year from a West Valley institution. Includes all award levels. May be greater than the actual number of students who graduated, as Lightcast includes both primary and secondary majors. Both primary and secondary majors are included because a graduate with a dual major in mathematics and electrical engineering should be considered part of the potential supply for occupations that map to both majors.
The reference period for a completion year is July 1 of the prior year through June 30 of the current year. For example, the 2017 Completions metric is a count of completions from 7/1/2016-6/30/2017.
Employment Concentration:
Employment Concentration (also known as Location Quotient) quantifies the concentration of employed workers in a region relative to the national average. It can reveal what makes a particular region “unique” in comparison to the national average. For example, if the leather products manufacturing industry accounts for .02% of jobs in your area but .01% of jobs nationally, then the area’s leather-producing industry has a concentration of .02 ÷ .01 = 2.0 in your area (as compared to the nation). So in your area, leather manufacturing accounts for a larger than average “share” of total workers — the share is twice as big as normal. Source: Lightcast's proprietary employment data.
Automation Index:
Lightcast's US Automation Index analyzes the potential automation risk of occupations based on job task content—derived from ONET work activities. Combining that data with the Frey and Osborne findings at the occupation level, we identify which job tasks are 'at risk' and which are resilient. We also incorporate data to identify where occupations cluster in industries facing disruption, and where workers' skills mean their nearest job options are also facing automation risk. This is a 100-based index, meaning that occupations with an automation index above 100 have an above average risk of automation, while occupations with an automation index of below 100 have a below average risk of automation.
Note: automation index is unavailable for Legislators, Military, and Unclassified occupations, so they are excluded from aggregate indexes for higher-level occupations.
Resident Workers:
Individuals that live in the region and hold the occupation but may work outside of the region.
Source: This data comes from the Census LODES data, specifically from Origin and Destination (OD) data, Regional Area Characteristics (RAC), and Workforce Area Characteristics (WAC) data which Lightcast applies to our occupation jobs figures.
